The 2026 Fortnite UGC Marketing Playbook
Executive Summary
Fortnite in 2026 operates less like a single game and more like a multi-mode, creator-driven attention ecosystem where brand outcomes are governed by distribution dynamics: where audiences already aggregate, how often they repeat loops, and how discoverability is earned or bought.
Two platform facts make this unavoidable for agencies:
Creator-made experiences are now a meaningful share of overall Fortnite consumption. Epic Games reported that in 2024 the creator community grew to 70,000 creators and 198,000 published islands, and players spent 5.23 billion hours in creator-made games, representing 36.5% of total Fortnite playtime.
Fortnite UGC economics and distribution are becoming explicitly campaignable. Engagement payouts allocate 40% of eligible net revenue into an engagement pool distributed based on engagement signals, while Sponsored Row adds paid discovery with reporting for impressions, CPM, and clicks.
The brand strategy shift follows these mechanics. Naavik documents that brands are moving away from the “digital real estate” model—standalone destinations that struggle to sustain a player base—and toward integrations inside existing hits.
The core claim of this playbook is therefore structural rather than stylistic:
High-traffic UGC integrations outperform standalone brand experiences on reach and efficiency because they inherit distribution and convert repeat play loops into repeat exposure.
Methodology and Assumptions
Campaign metrics in this report come from campaign analytics and are presented only as aggregated outputs suitable for publication. Underlying raw files are not included in the public playbook.
Assumptions include:
• “Impressions” represent the best available exposure proxy for each campaign and are not fully standardized across surfaces such as in-experience looked-at events, lobby inventory, or Discover thumbnail impressions.
• Impressions per player equals impressions divided by players reached.
• Fifteen-second equivalent exposures equal minutes multiplied by four and are used only as a time-equivalence lens, not a claim of equal persuasive impact versus video advertising.
State of Brand Marketing (2020–2026)
The “owned world era” expanded rapidly and then corrected because the limiting factor shifted from production capability to audience acquisition.
Naavik’s synthesis of GEEIQ tracking quantifies the rise and reset in Fortnite brand formats:
• Brand-owned experiences grew from 11 in 2020 to 231 in 2024
• Integrations were near zero early and then surged to 45 in 2024 and 65 in 2025
By 2025 the balance flipped toward parity:
• Owned experiences fell to 75 from 231 in 2024
• Integrations climbed to 65 from 45
The market interpretation is not that brand demand slowed. Instead, brands learned what scales.
Naavik reports that brands increasingly abandoned standalone worlds that struggled to maintain players, favoring high-impact integrations within existing hits.
The top ten integrations into pre-existing games generated twice the impressions of the top ten standalone brand games.
This marks the pivot from novelty to measurable distribution efficiency.
A second driver is the decay curve of standalone launches.
Naavik highlights an example where a custom Fortnite island launched strongly but dropped approximately 90% in average concurrent players by day seven. Marketers have also cited typical standalone build costs between $300,000 and $500,000.
This combination of high fixed cost and rapid player decay explains why owned-world volume fell as the channel matured.
Understanding Fortnite UGC
Fortnite UGC in 2026 is best modeled as a creator publishing economy with monetization, paid discovery, and commerce primitives.
Creation accelerated with Unreal Editor for Fortnite (UEFN) and Creator Economy 2.0.
Epic positioned UEFN alongside engagement payouts, which distribute 40% of Fortnite’s net revenue from the Item Shop and most real-money purchases proportionally to eligible island creators based on engagement.
Monetization has expanded beyond engagement payouts.
Epic’s in-island transactions initiative introduced direct sales inside islands and documented revenue share and pricing rules, including a period where developers earn 100% of V-Bucks value through January 31, 2027, before reverting to 50% revenue share.
Distribution is now explicitly campaign-operational.
Sponsored Row enables auction-based paid discoverability and Creator Portal reporting, and Epic states sponsorship revenue flows into the engagement payout pool at 100% through the end of 2026, then 50% long-term.
The ecosystem constraint is no longer lack of content but discoverability.
Naavik notes that nearly half a million maps compete for attention, creating a widening gap between being published and being played.
Why this matters for brands:
UGC is where attention is aggregating, and gaming is absorbing time from other media.
A dentsu “Ready Player Brand” survey reported:
• Around 70% of UK adults engage in gaming
• More than half play daily
• Around 25% expect to spend less time on social media to make room for gaming
In the United States, dentsu research shows two-thirds of consumers feel positively about brand integrations within games, and nearly half report purchasing a brand after seeing it featured in a video game.
Activation Models
In Fortnite UGC, activation models should be selected based on whether a brand wants audience acquisition or audience aggregation.
Standalone Branded Experience
A brand-built island designed as a destination.
Distribution advantage: Requires new audience formation through Discover and paid media.
Best suited for:
• Deep storytelling
• Owned community building
Primary metrics include:
• Unique players
• Retention
• Minutes played
• Return rate
Limited-Time Integration
A time-bounded integration inside a high-traffic UGC hit.
Distribution advantage: Inherits host traffic and repeat gameplay loops.
Best suited for:
• Scaling quickly around launches
• Cultural moments
• Tentpole campaigns
Measurement focuses on:
• Impressions
• Players reached
• Quests completed
• Interaction events


Cosmetics and Persistence Layer
Claimable or earnable items extending identity beyond a campaign window.
Advantages:
• Long-tail brand presence
• Repeat visibility through player expression
Metrics include:
• Adoption rate
• Repeat usage
• Cosmetic wear-time proxies
Lobby and High-Traffic Placements
Brand placements inside high-frequency surfaces such as lobbies or spawn zones.
Advantages:
• Repeated exposure through session structure
• Efficient awareness
Metrics include:
• Impressions
• Interactions
• Uplift proxies
Data Analysis
| Integration | Campaign Length (Days) | Players Reached | Impressions |
|---|---|---|---|
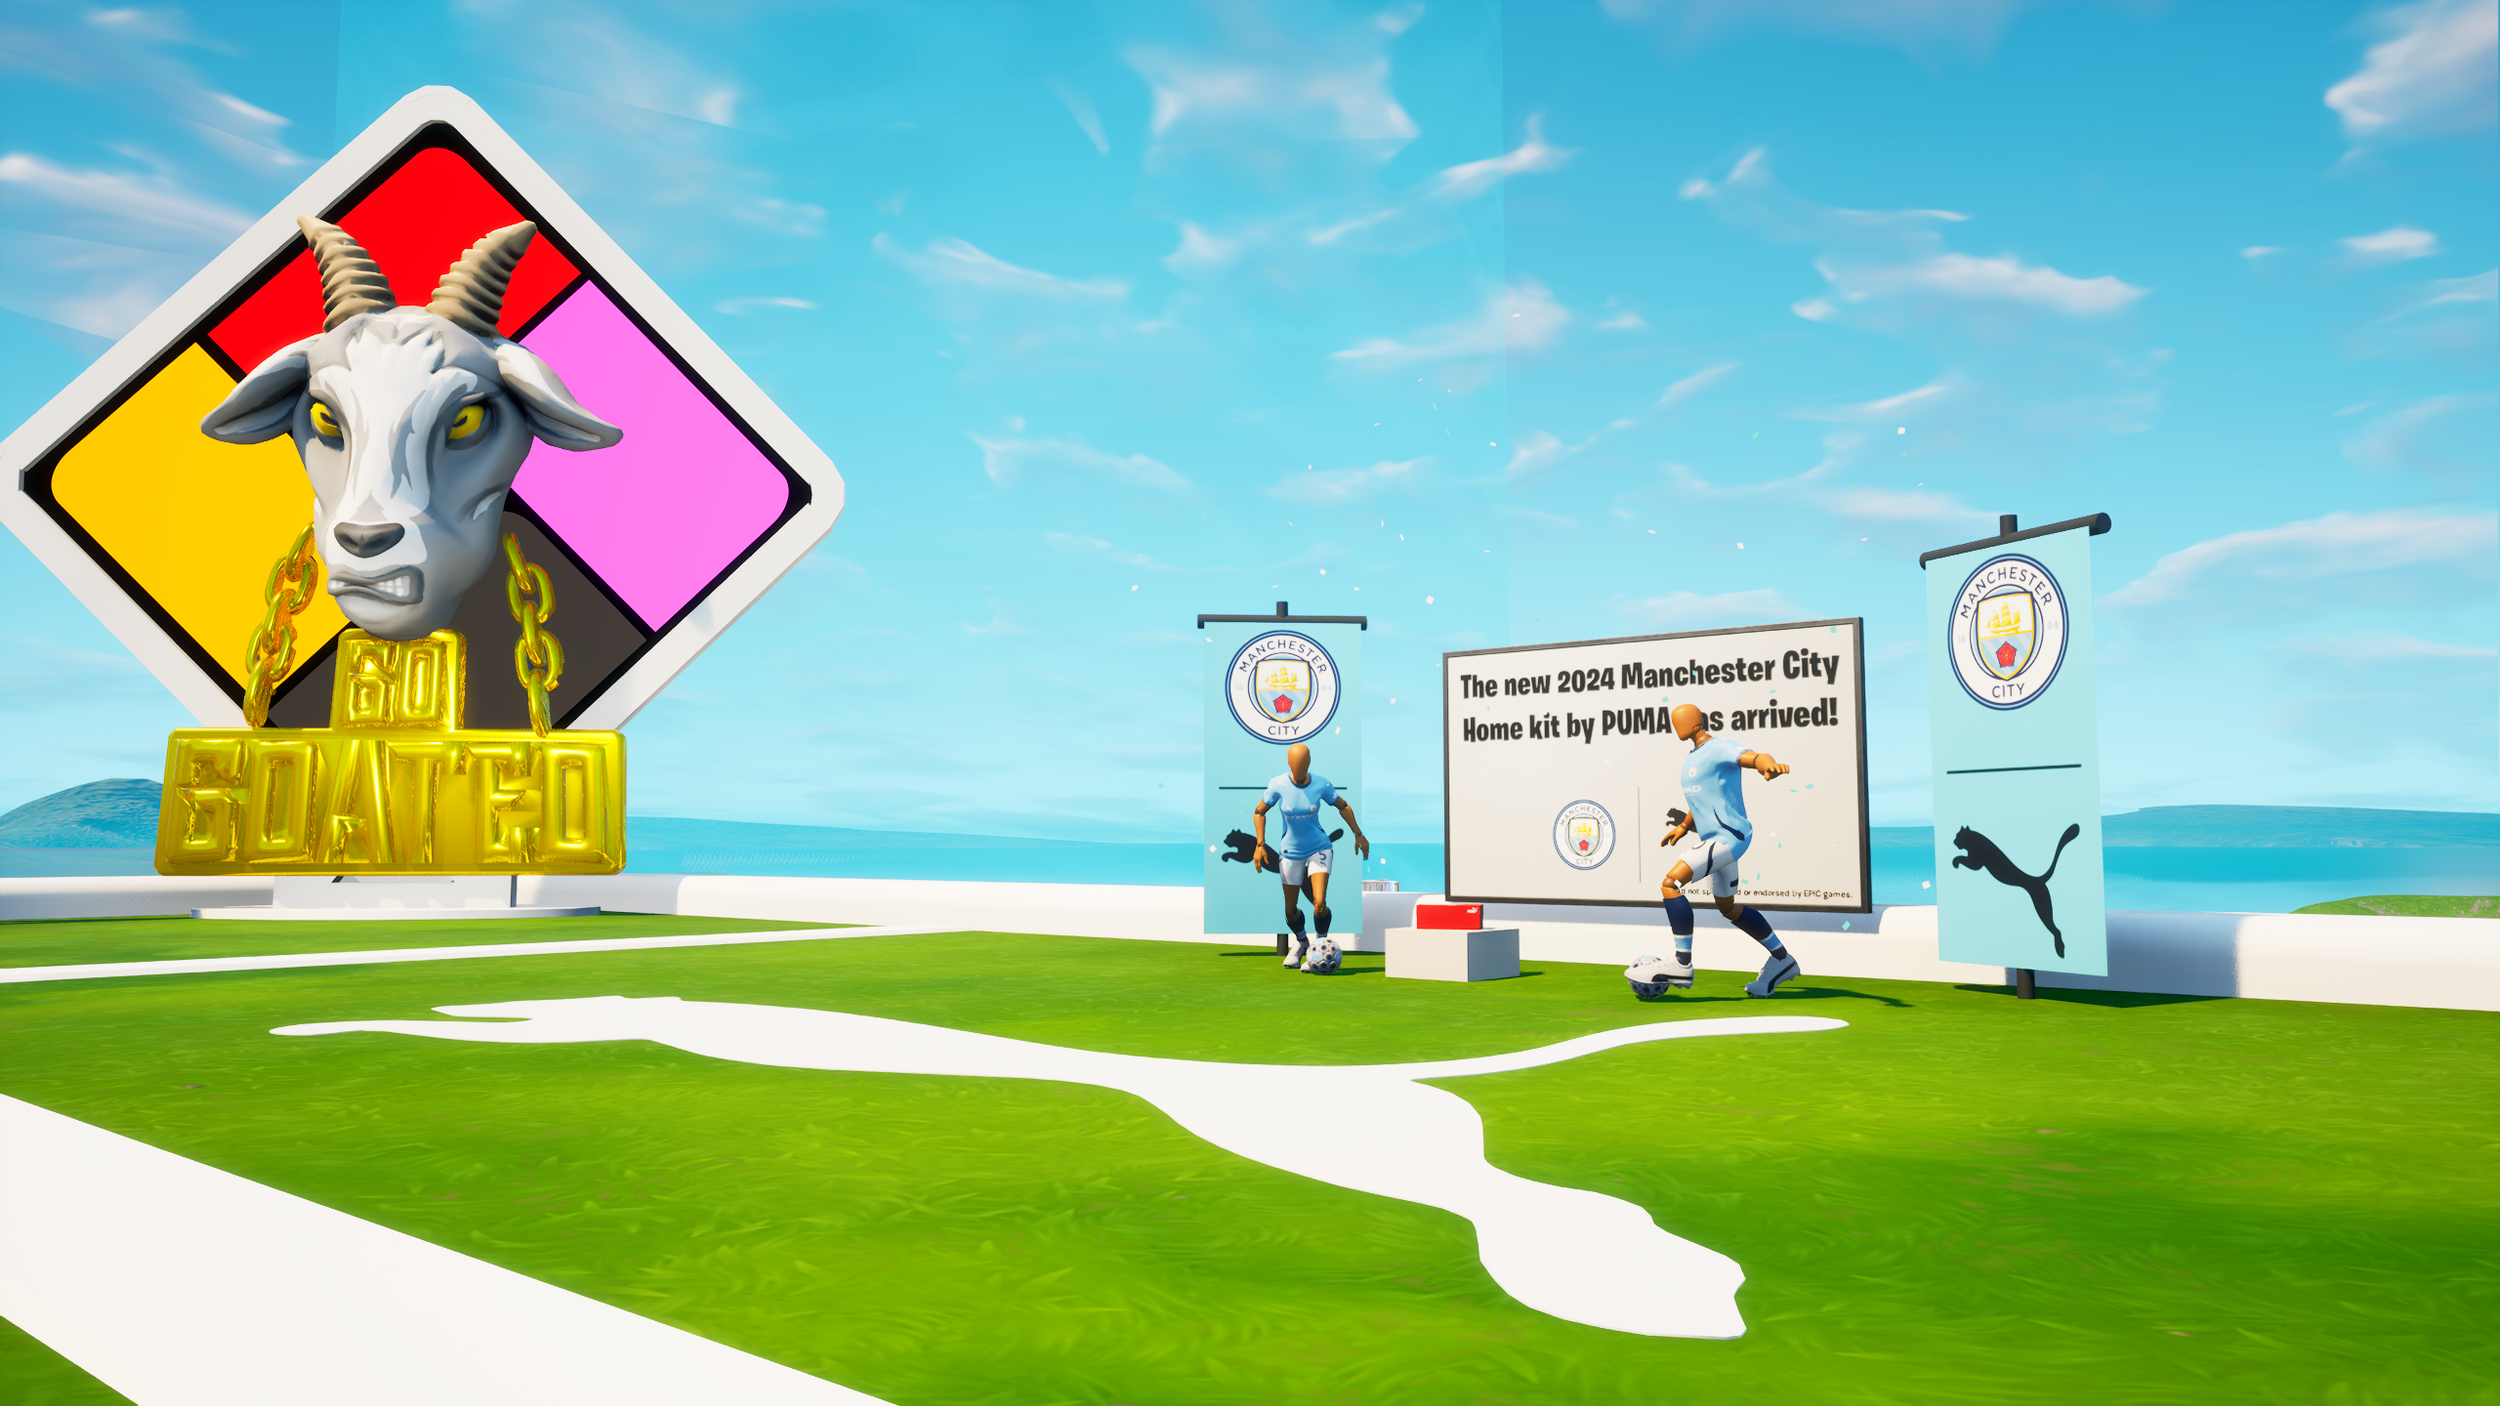
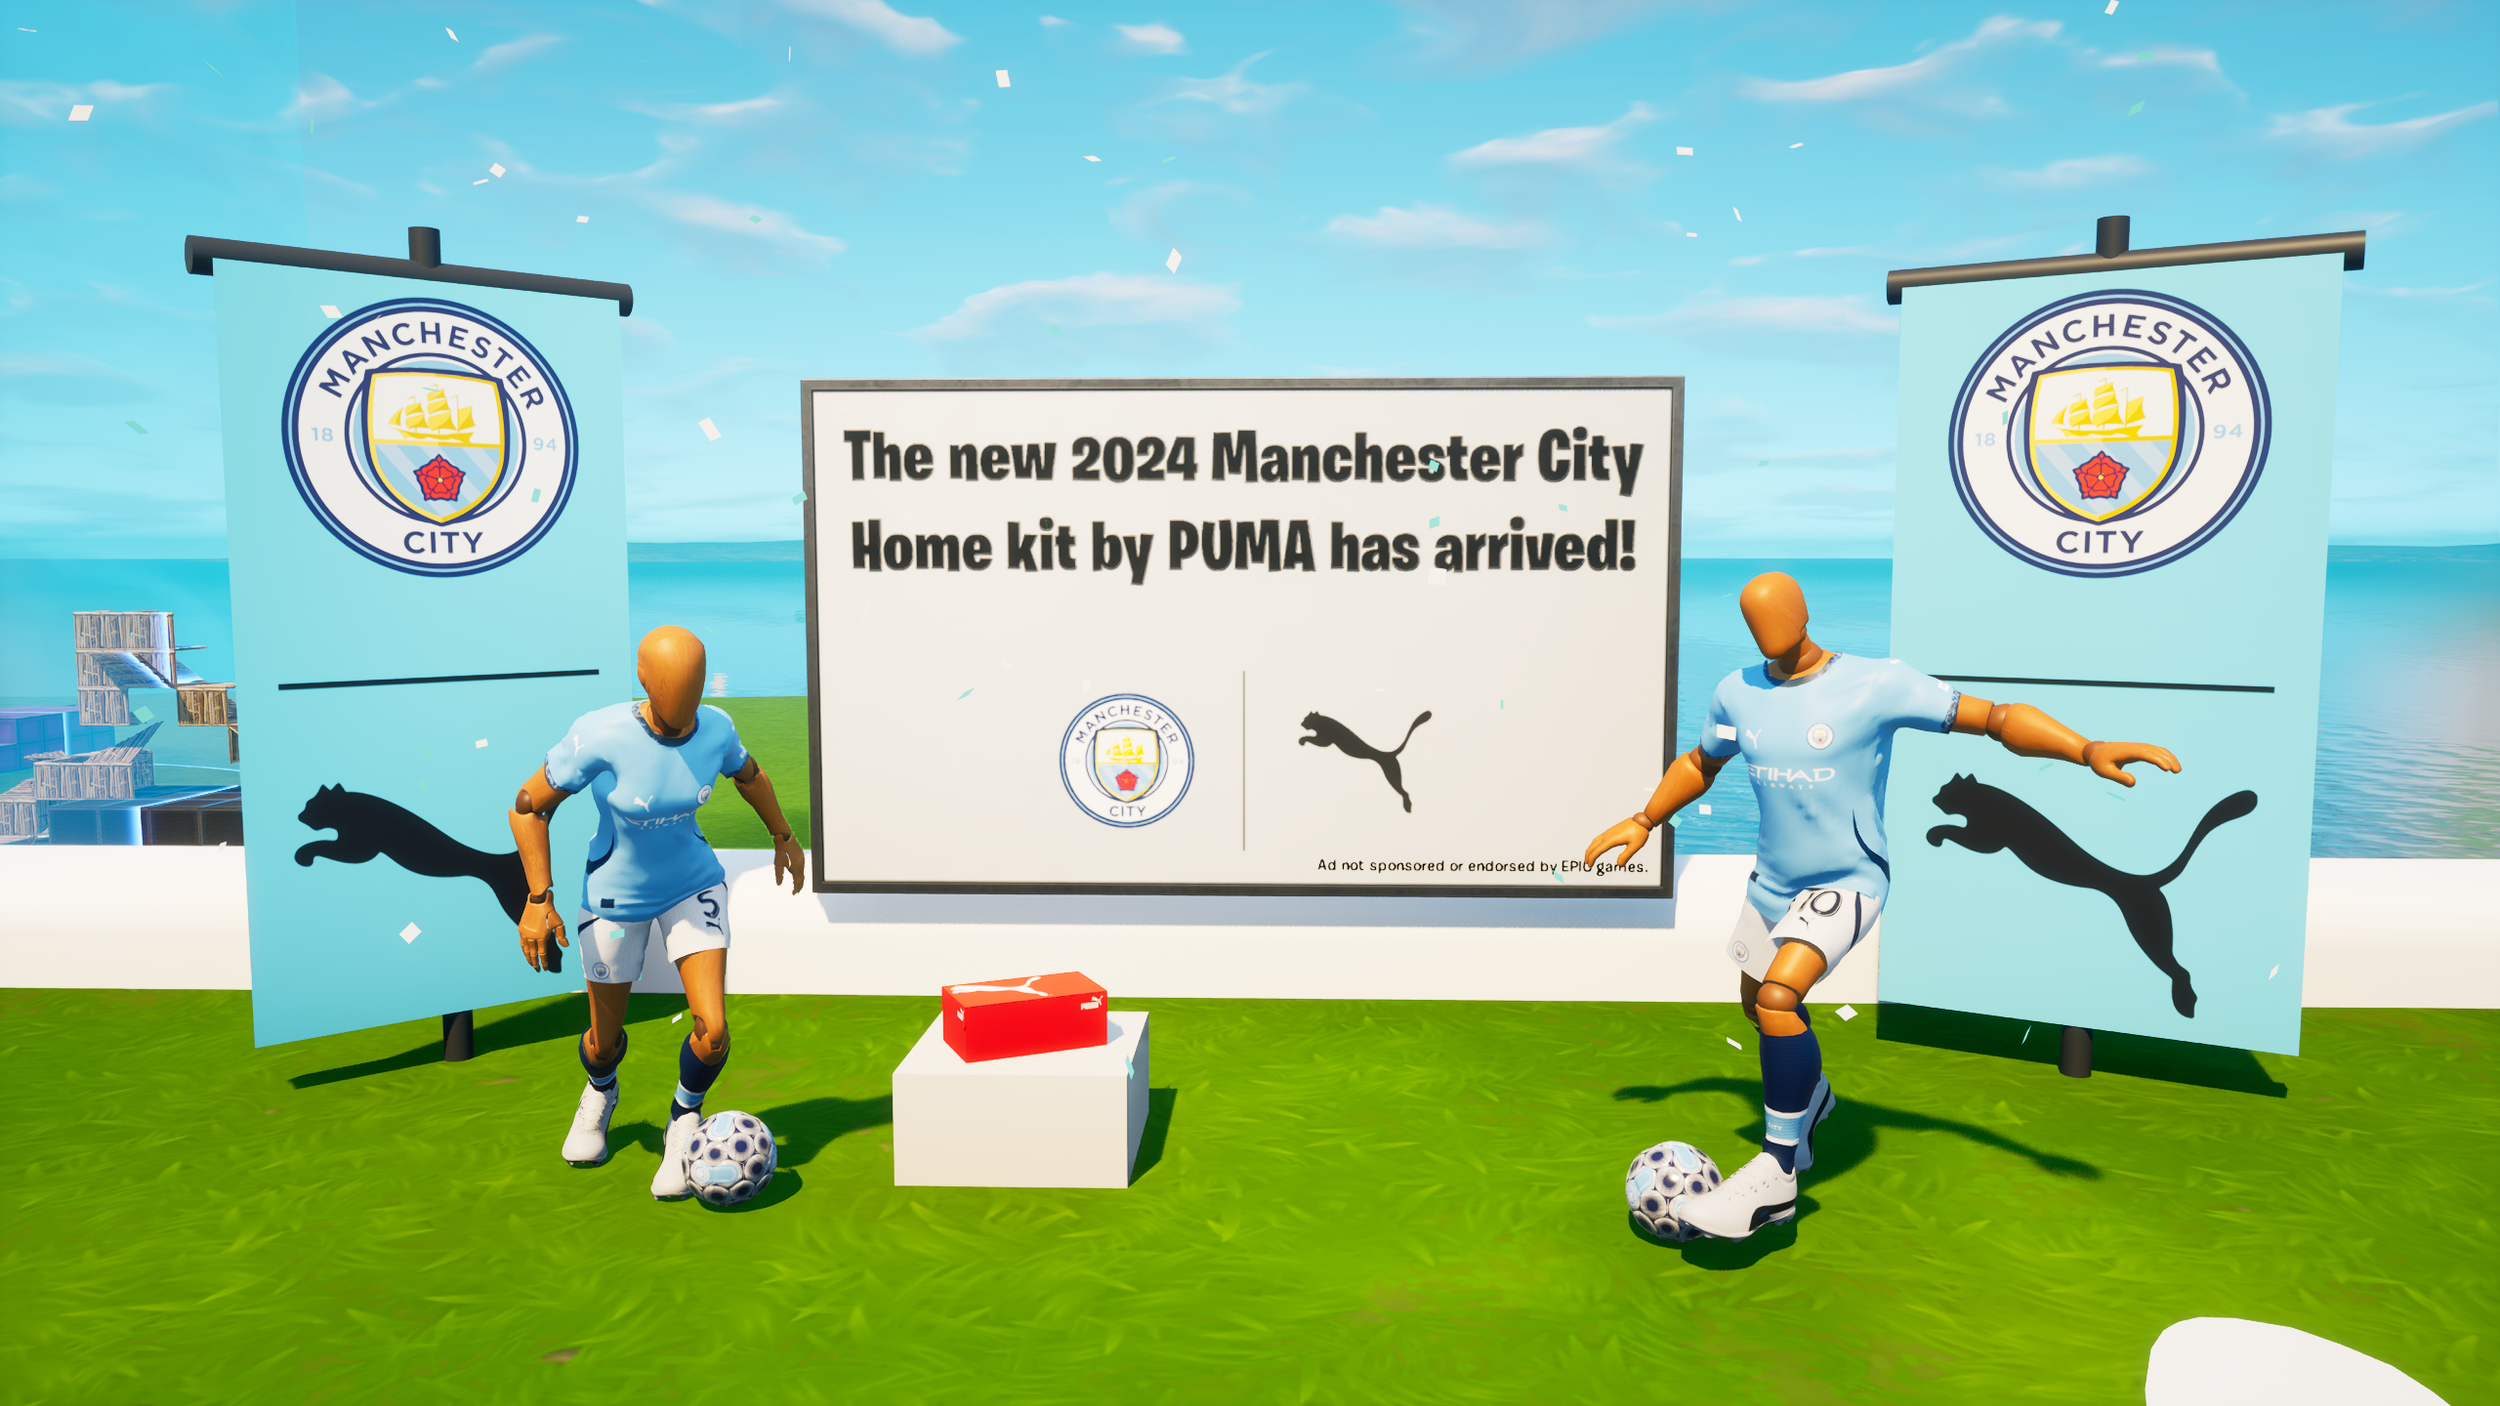
| Puma x Manchester City | 7 | 5,414,176 | 224,417,897 |
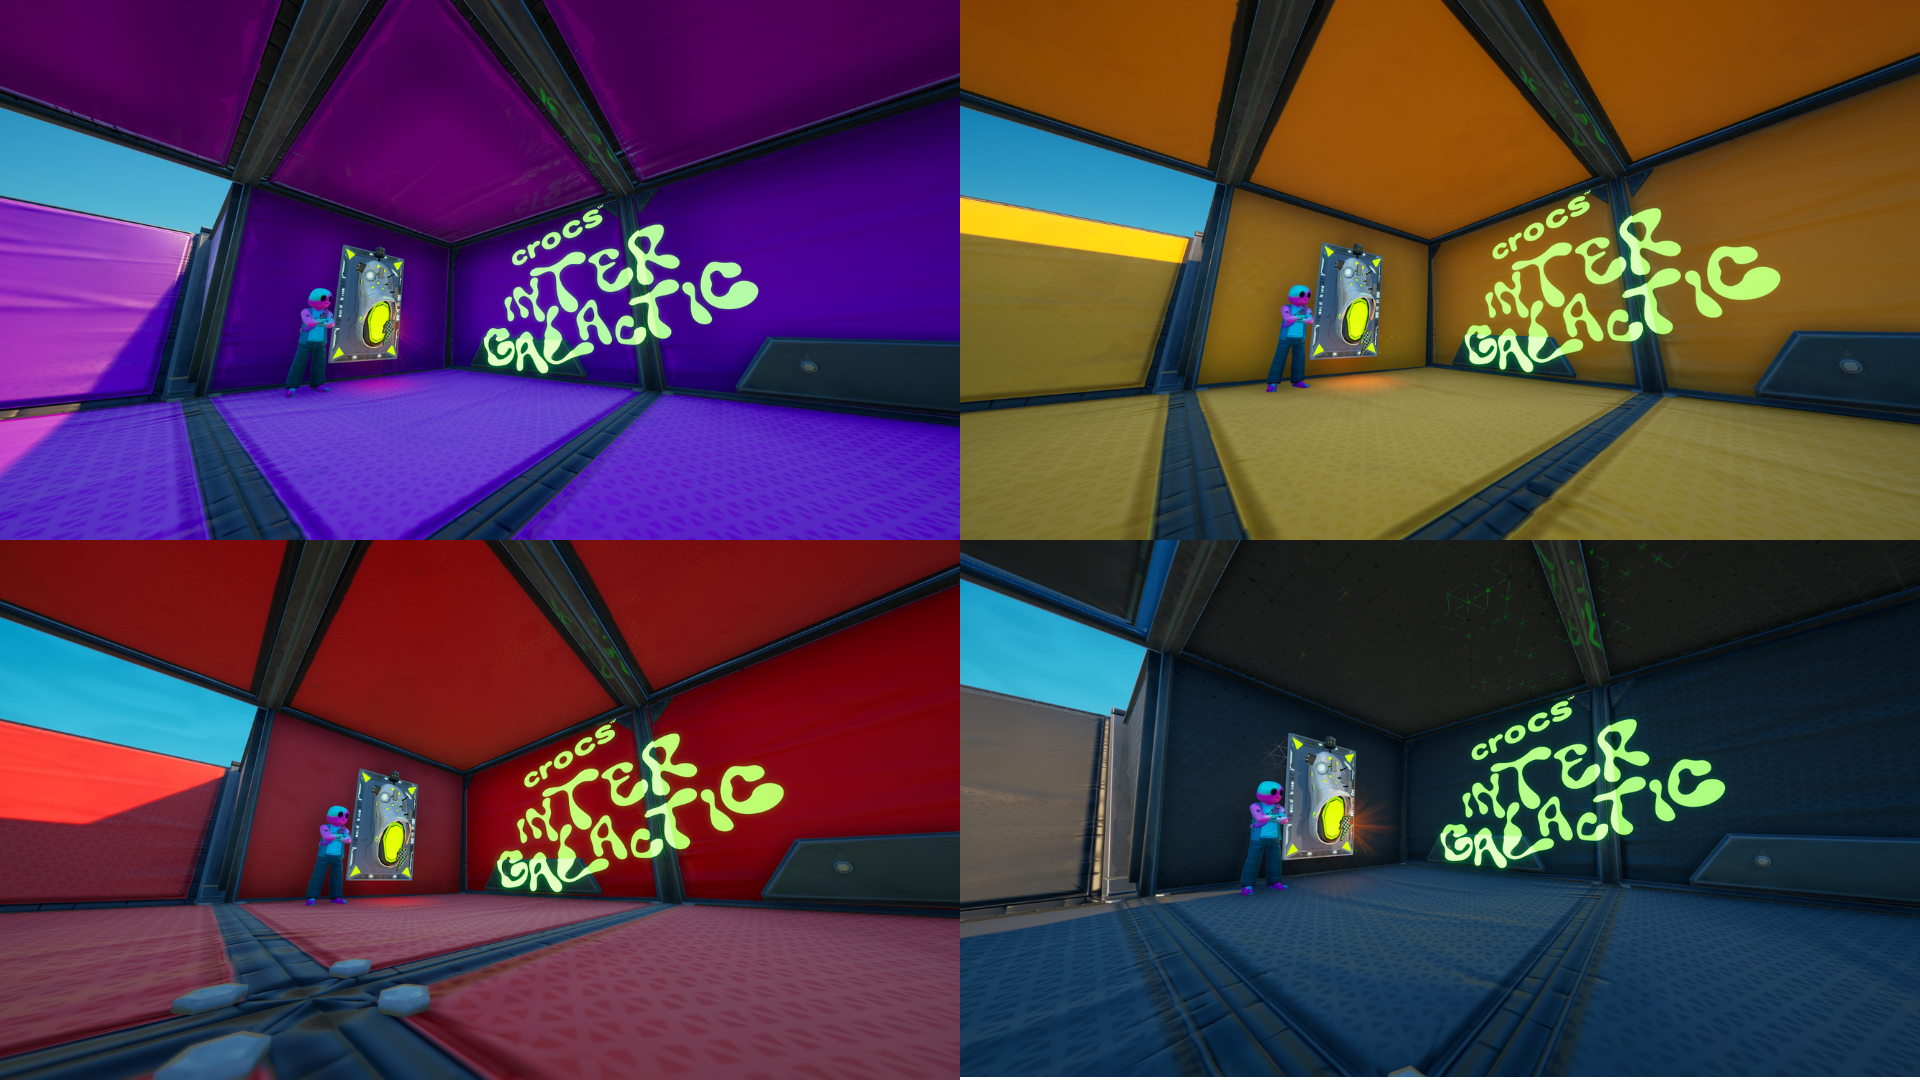
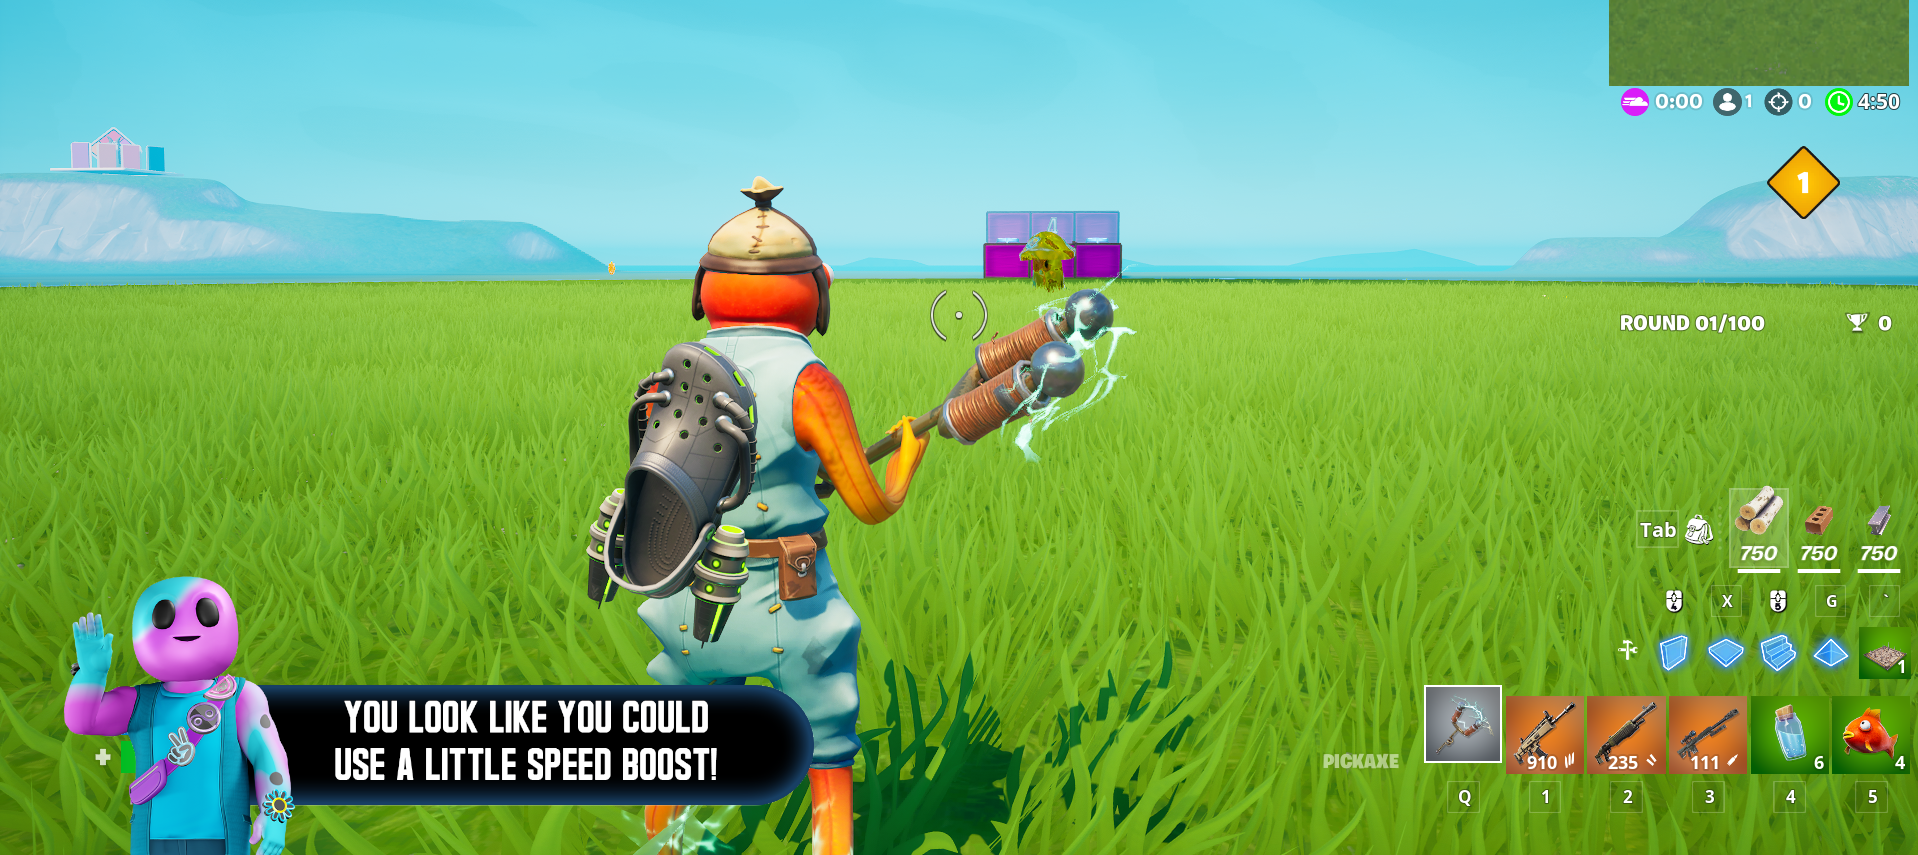
| Crocs | 21 | 1,191,714 | 29,518,028 |
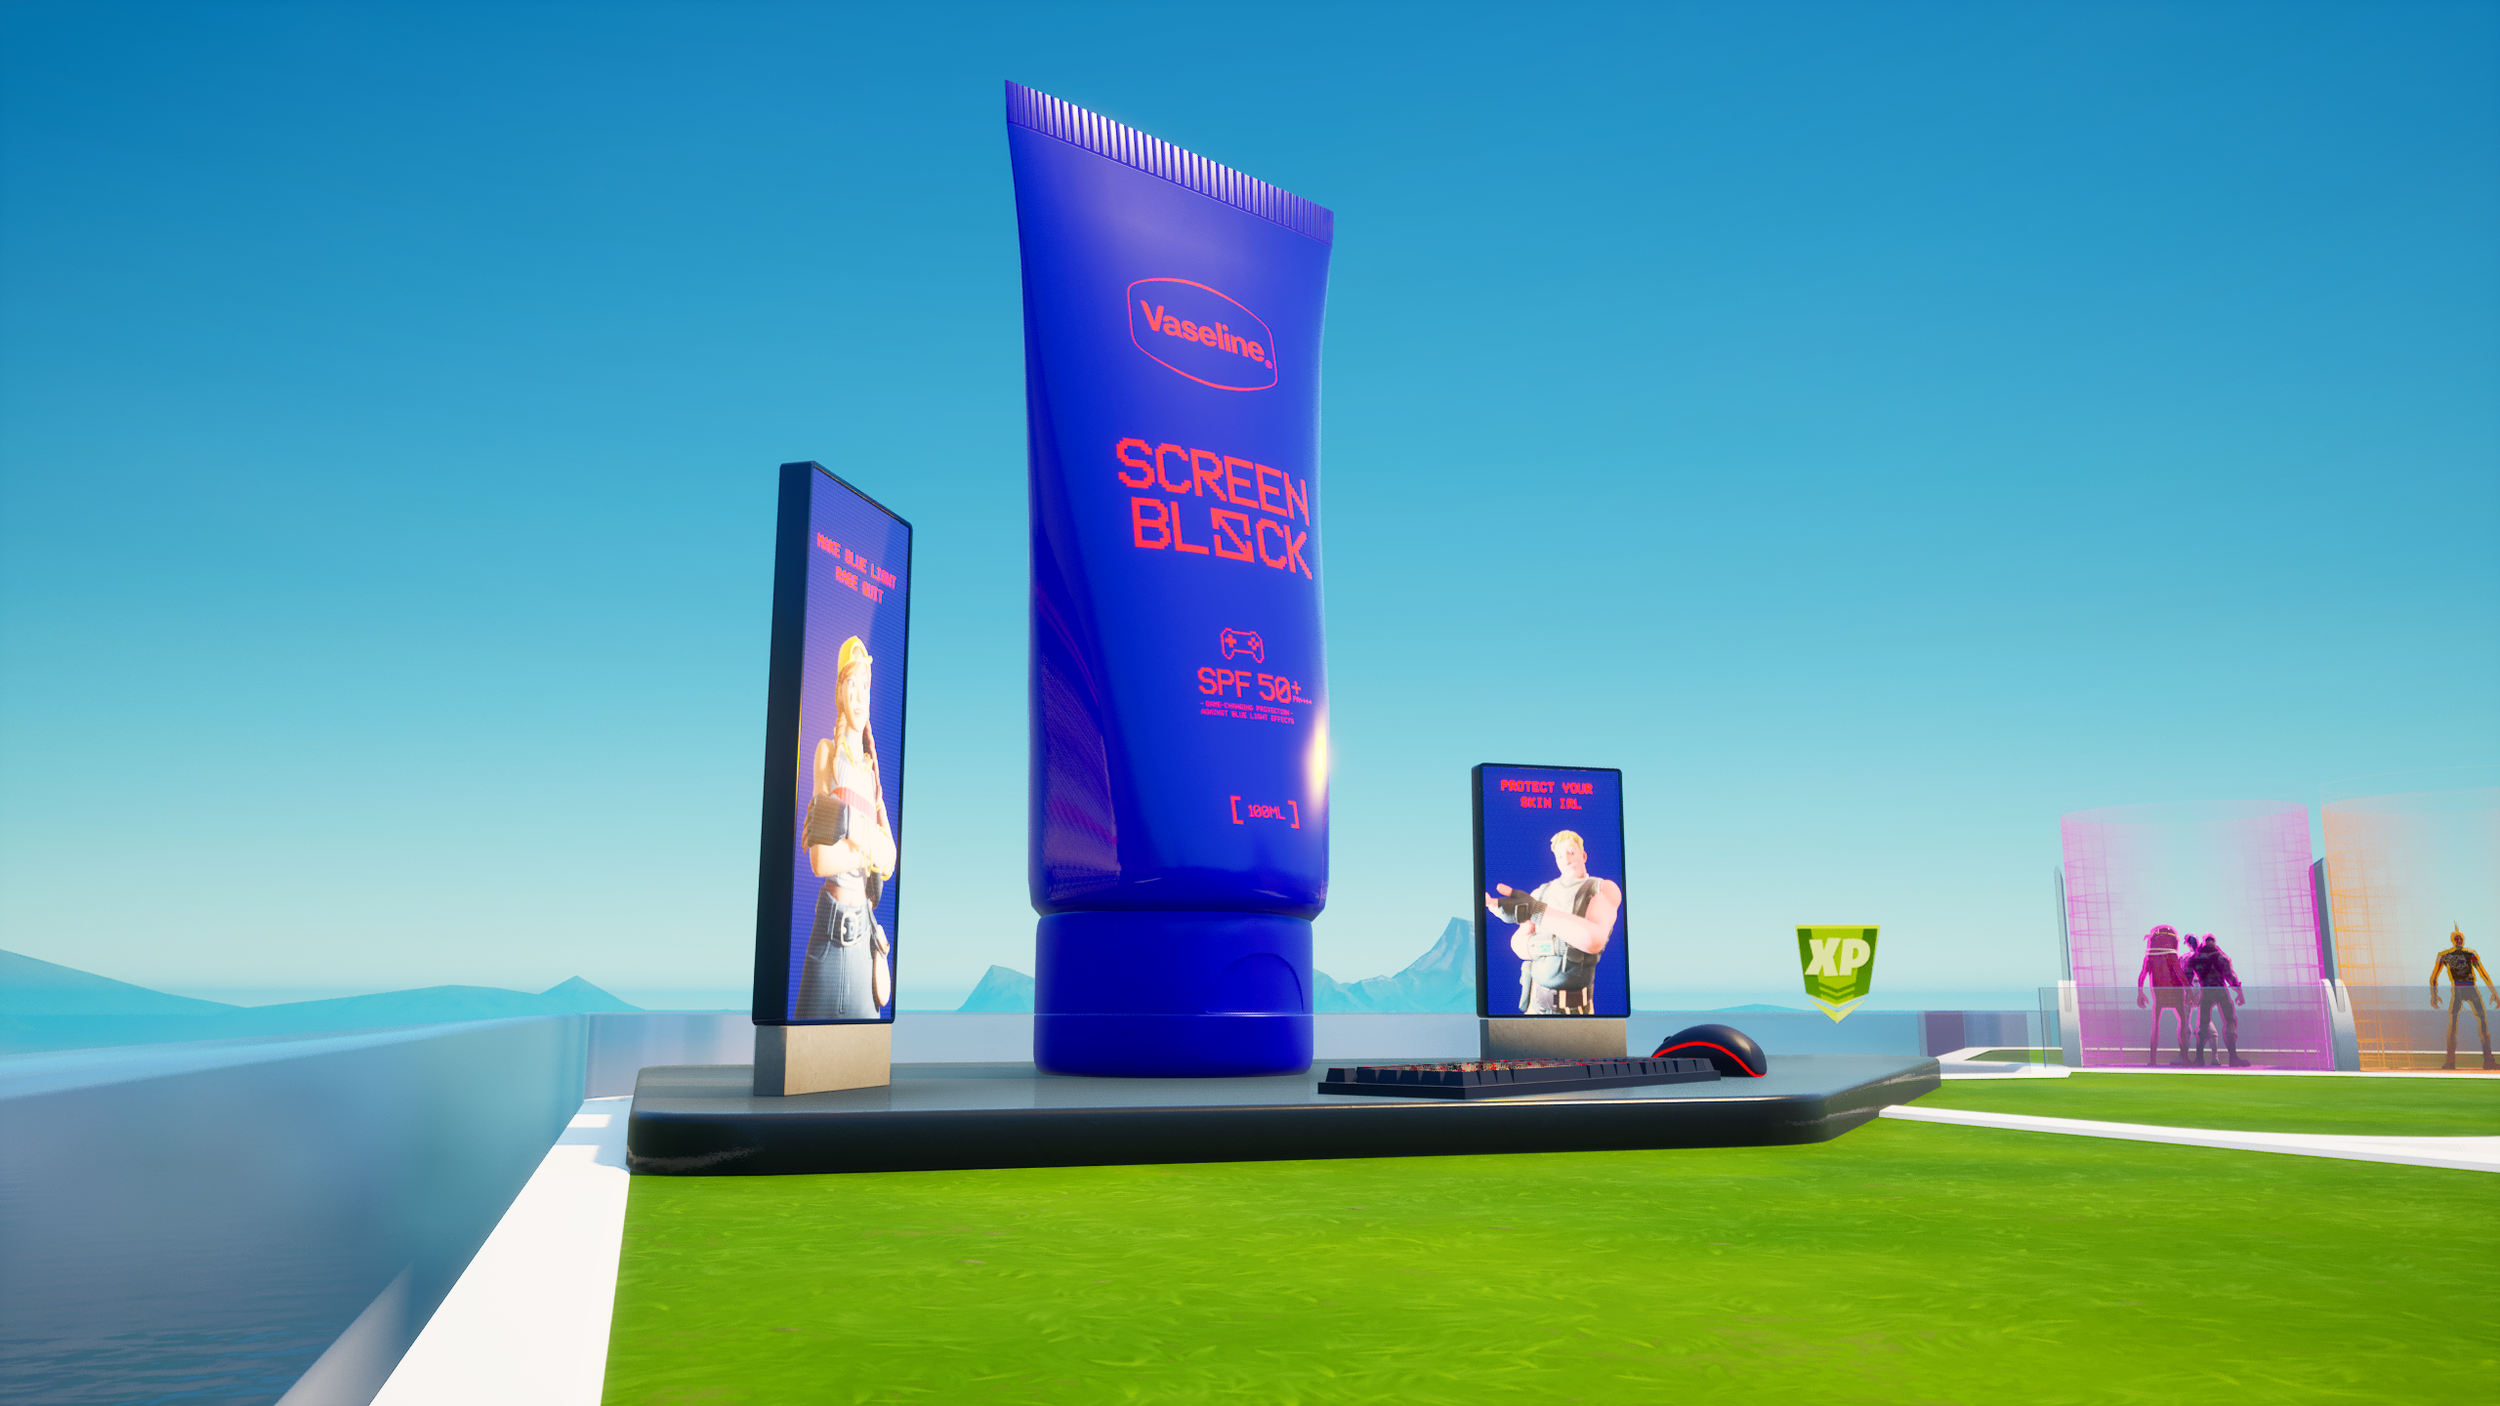
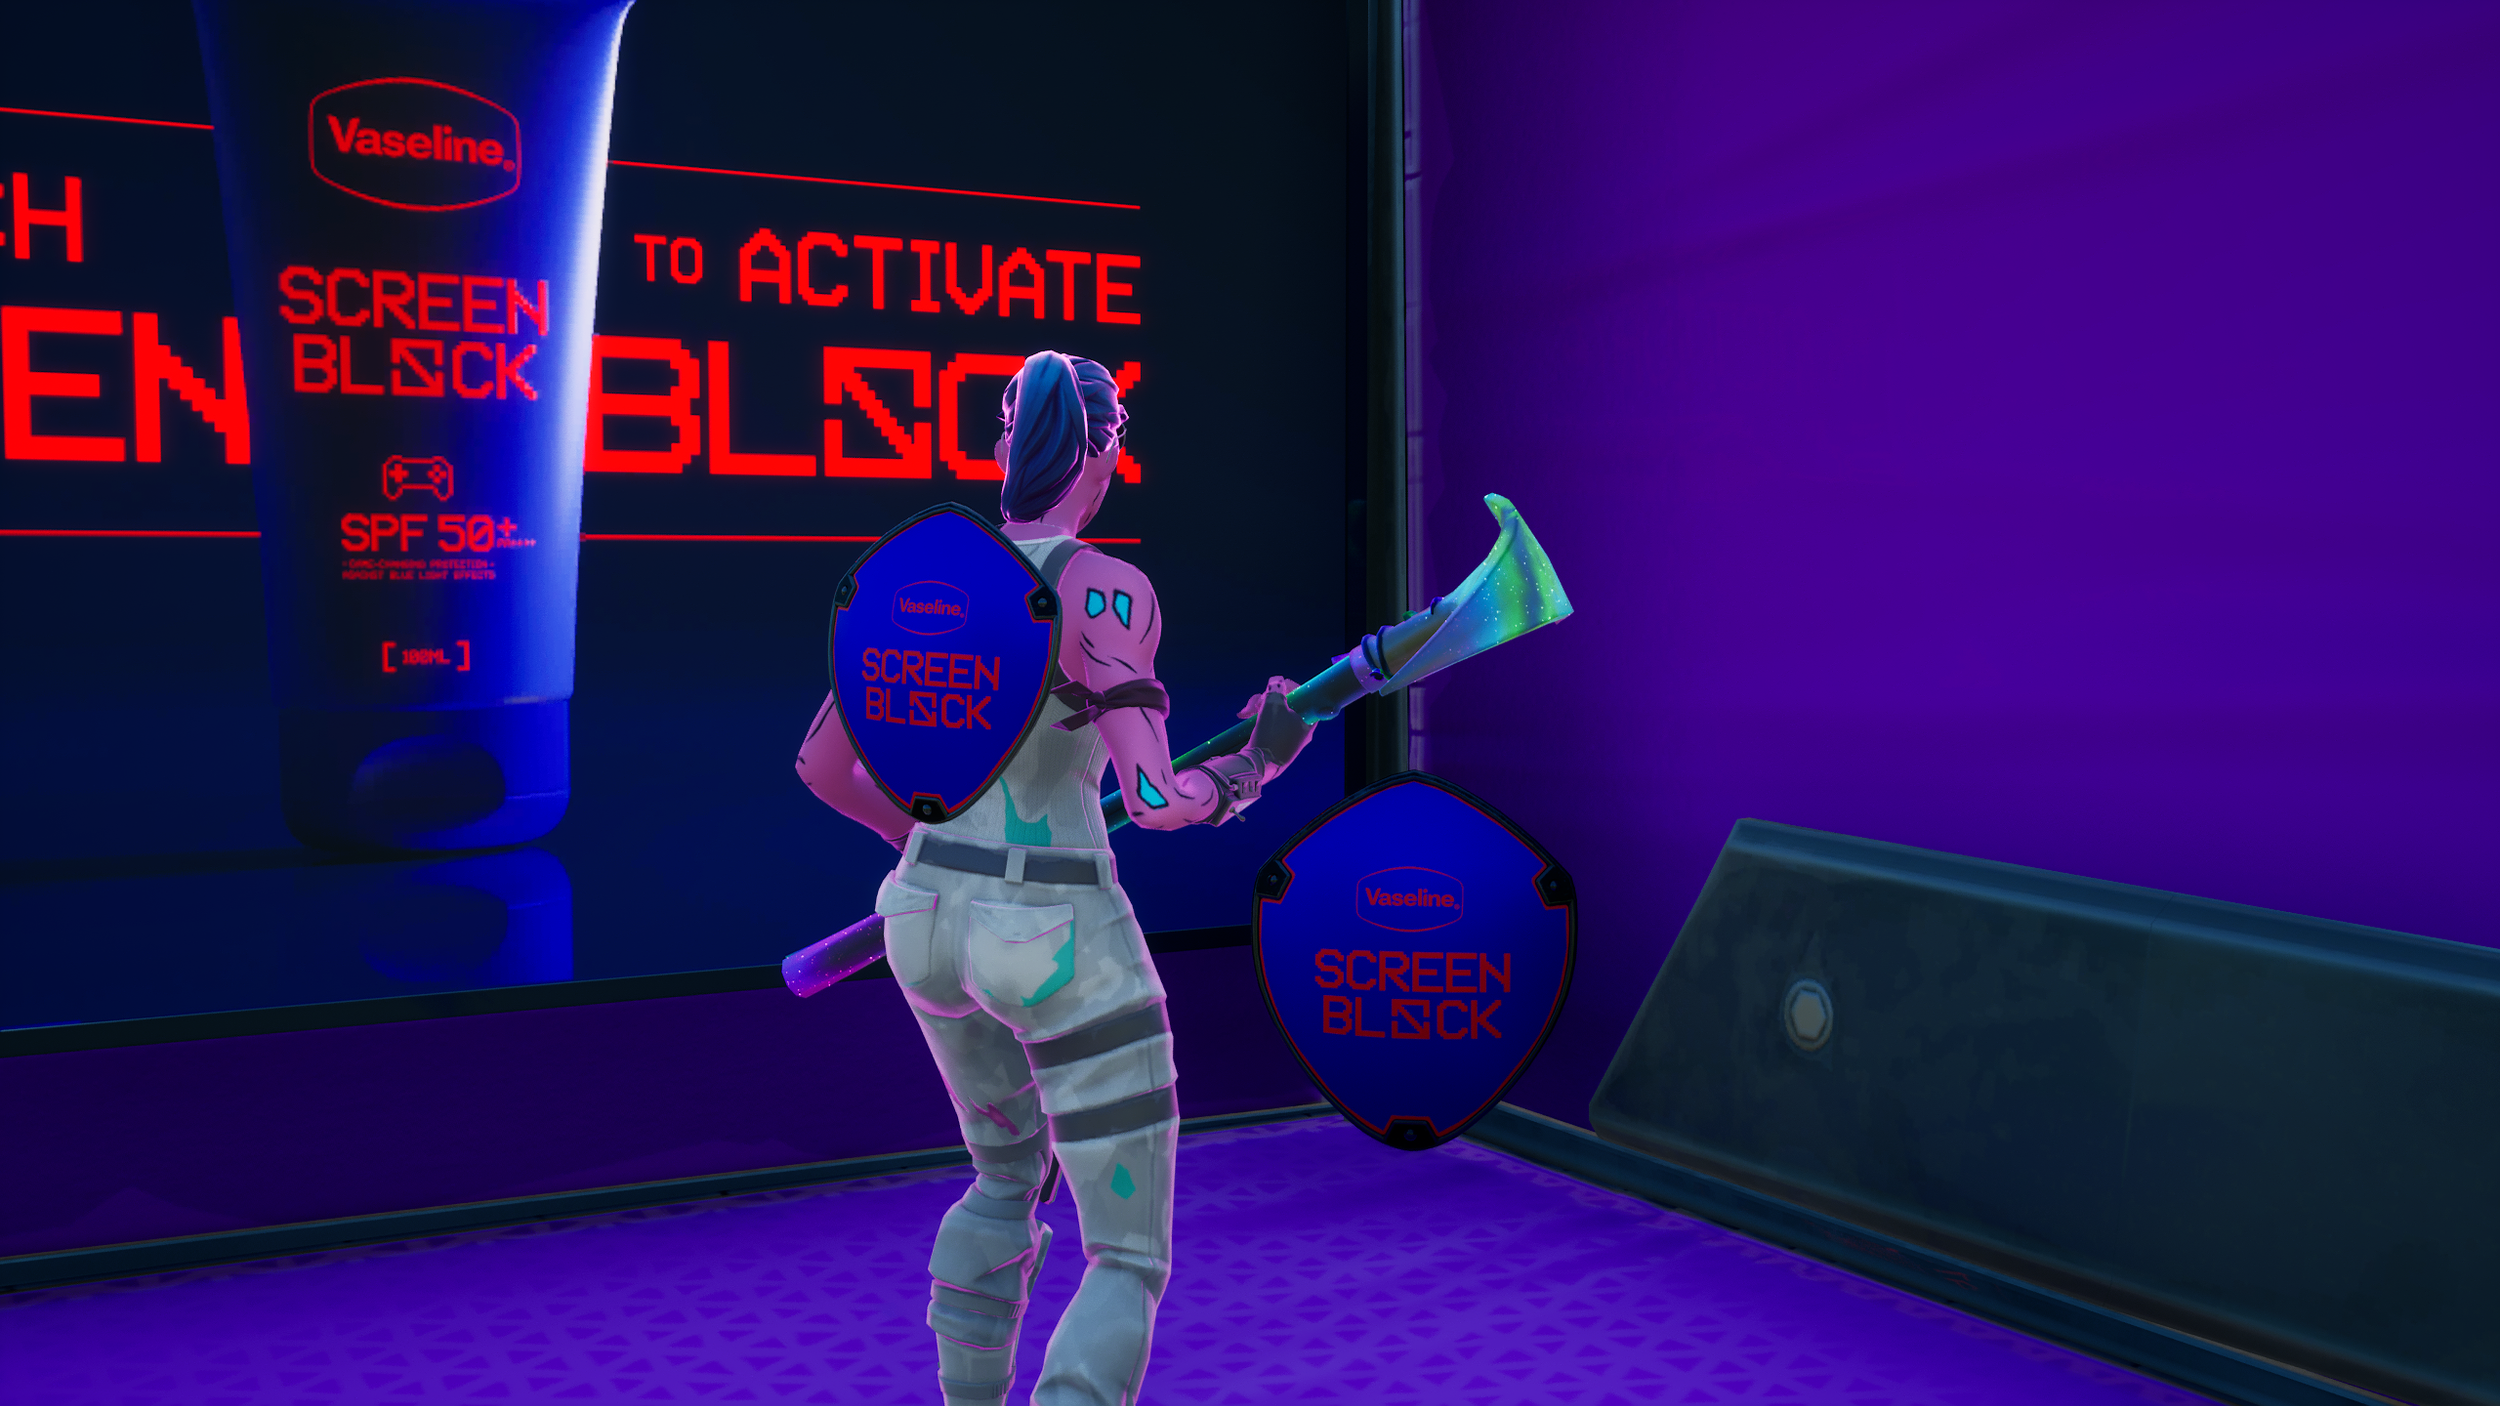
| Screen Block | 14 | 329,415 | 16,097,416 |
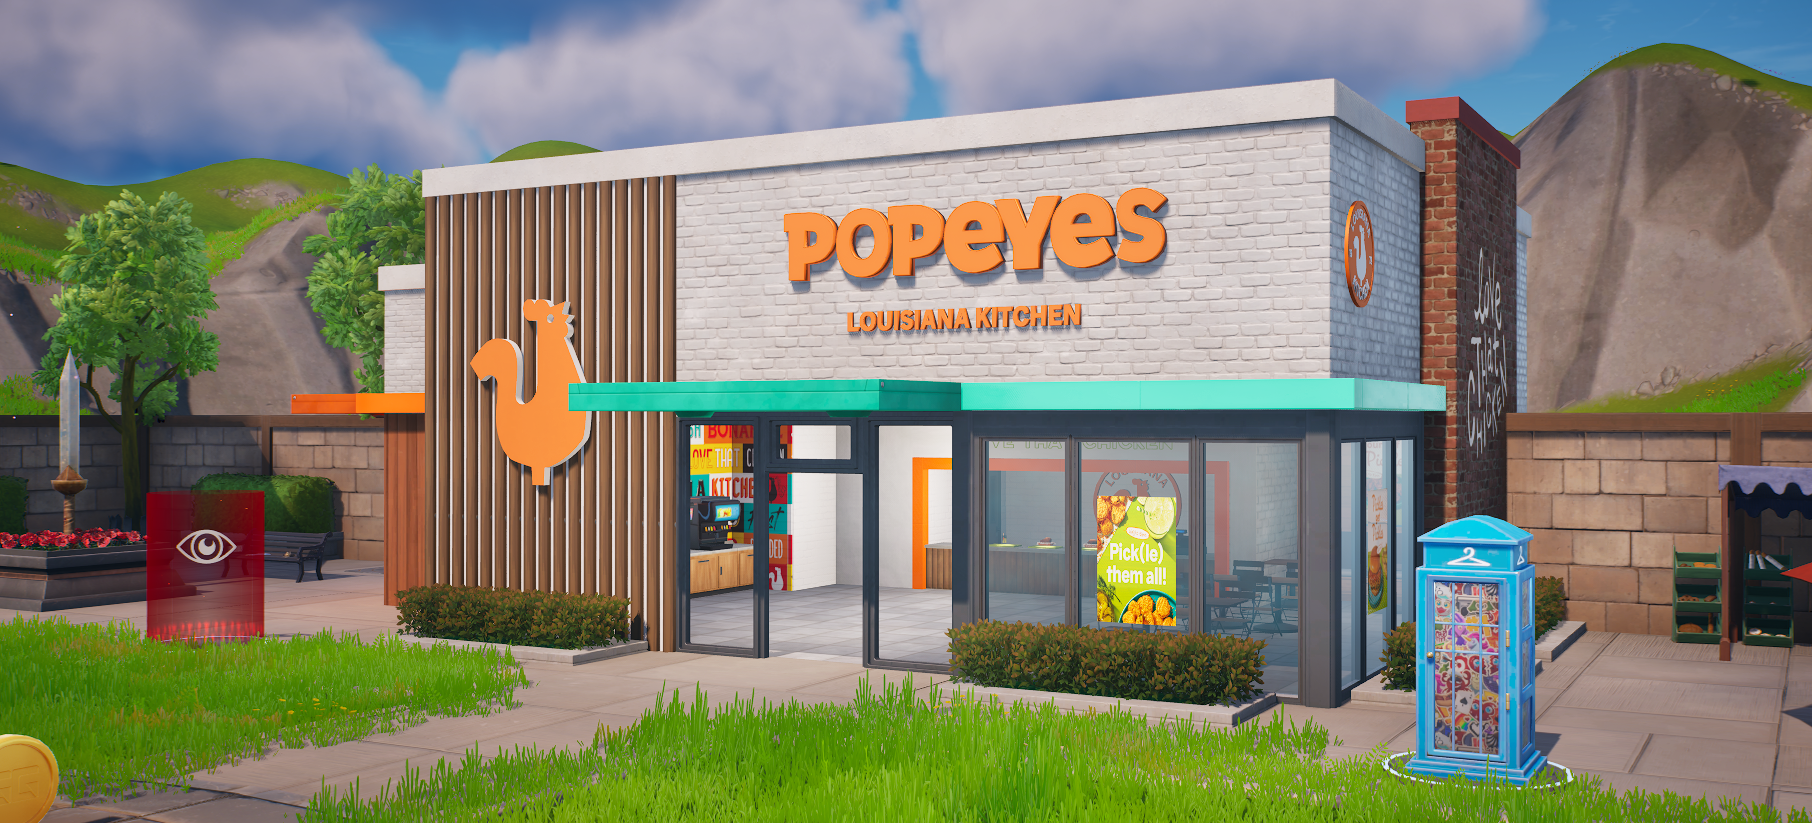
| Popeyes | 4 | 720,851 | 62,039,379 |
| Versace | 4 | 501,681 | 63,000,000 |
| Valentino | 14 | 3,452,336 | 176,659,488 |
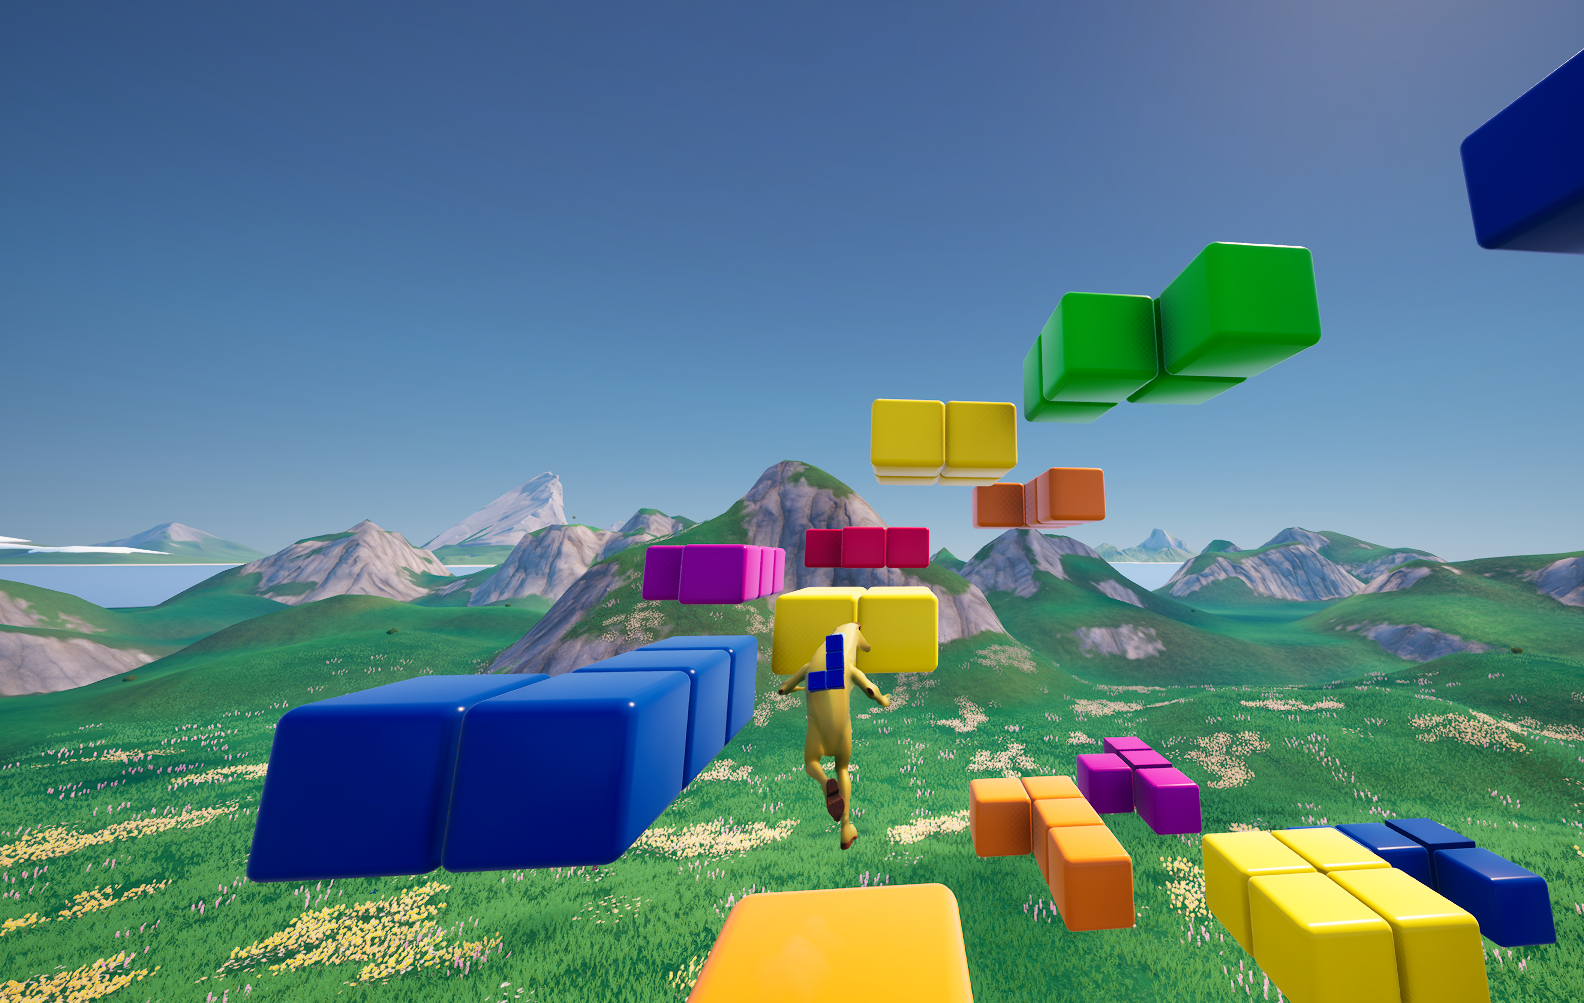
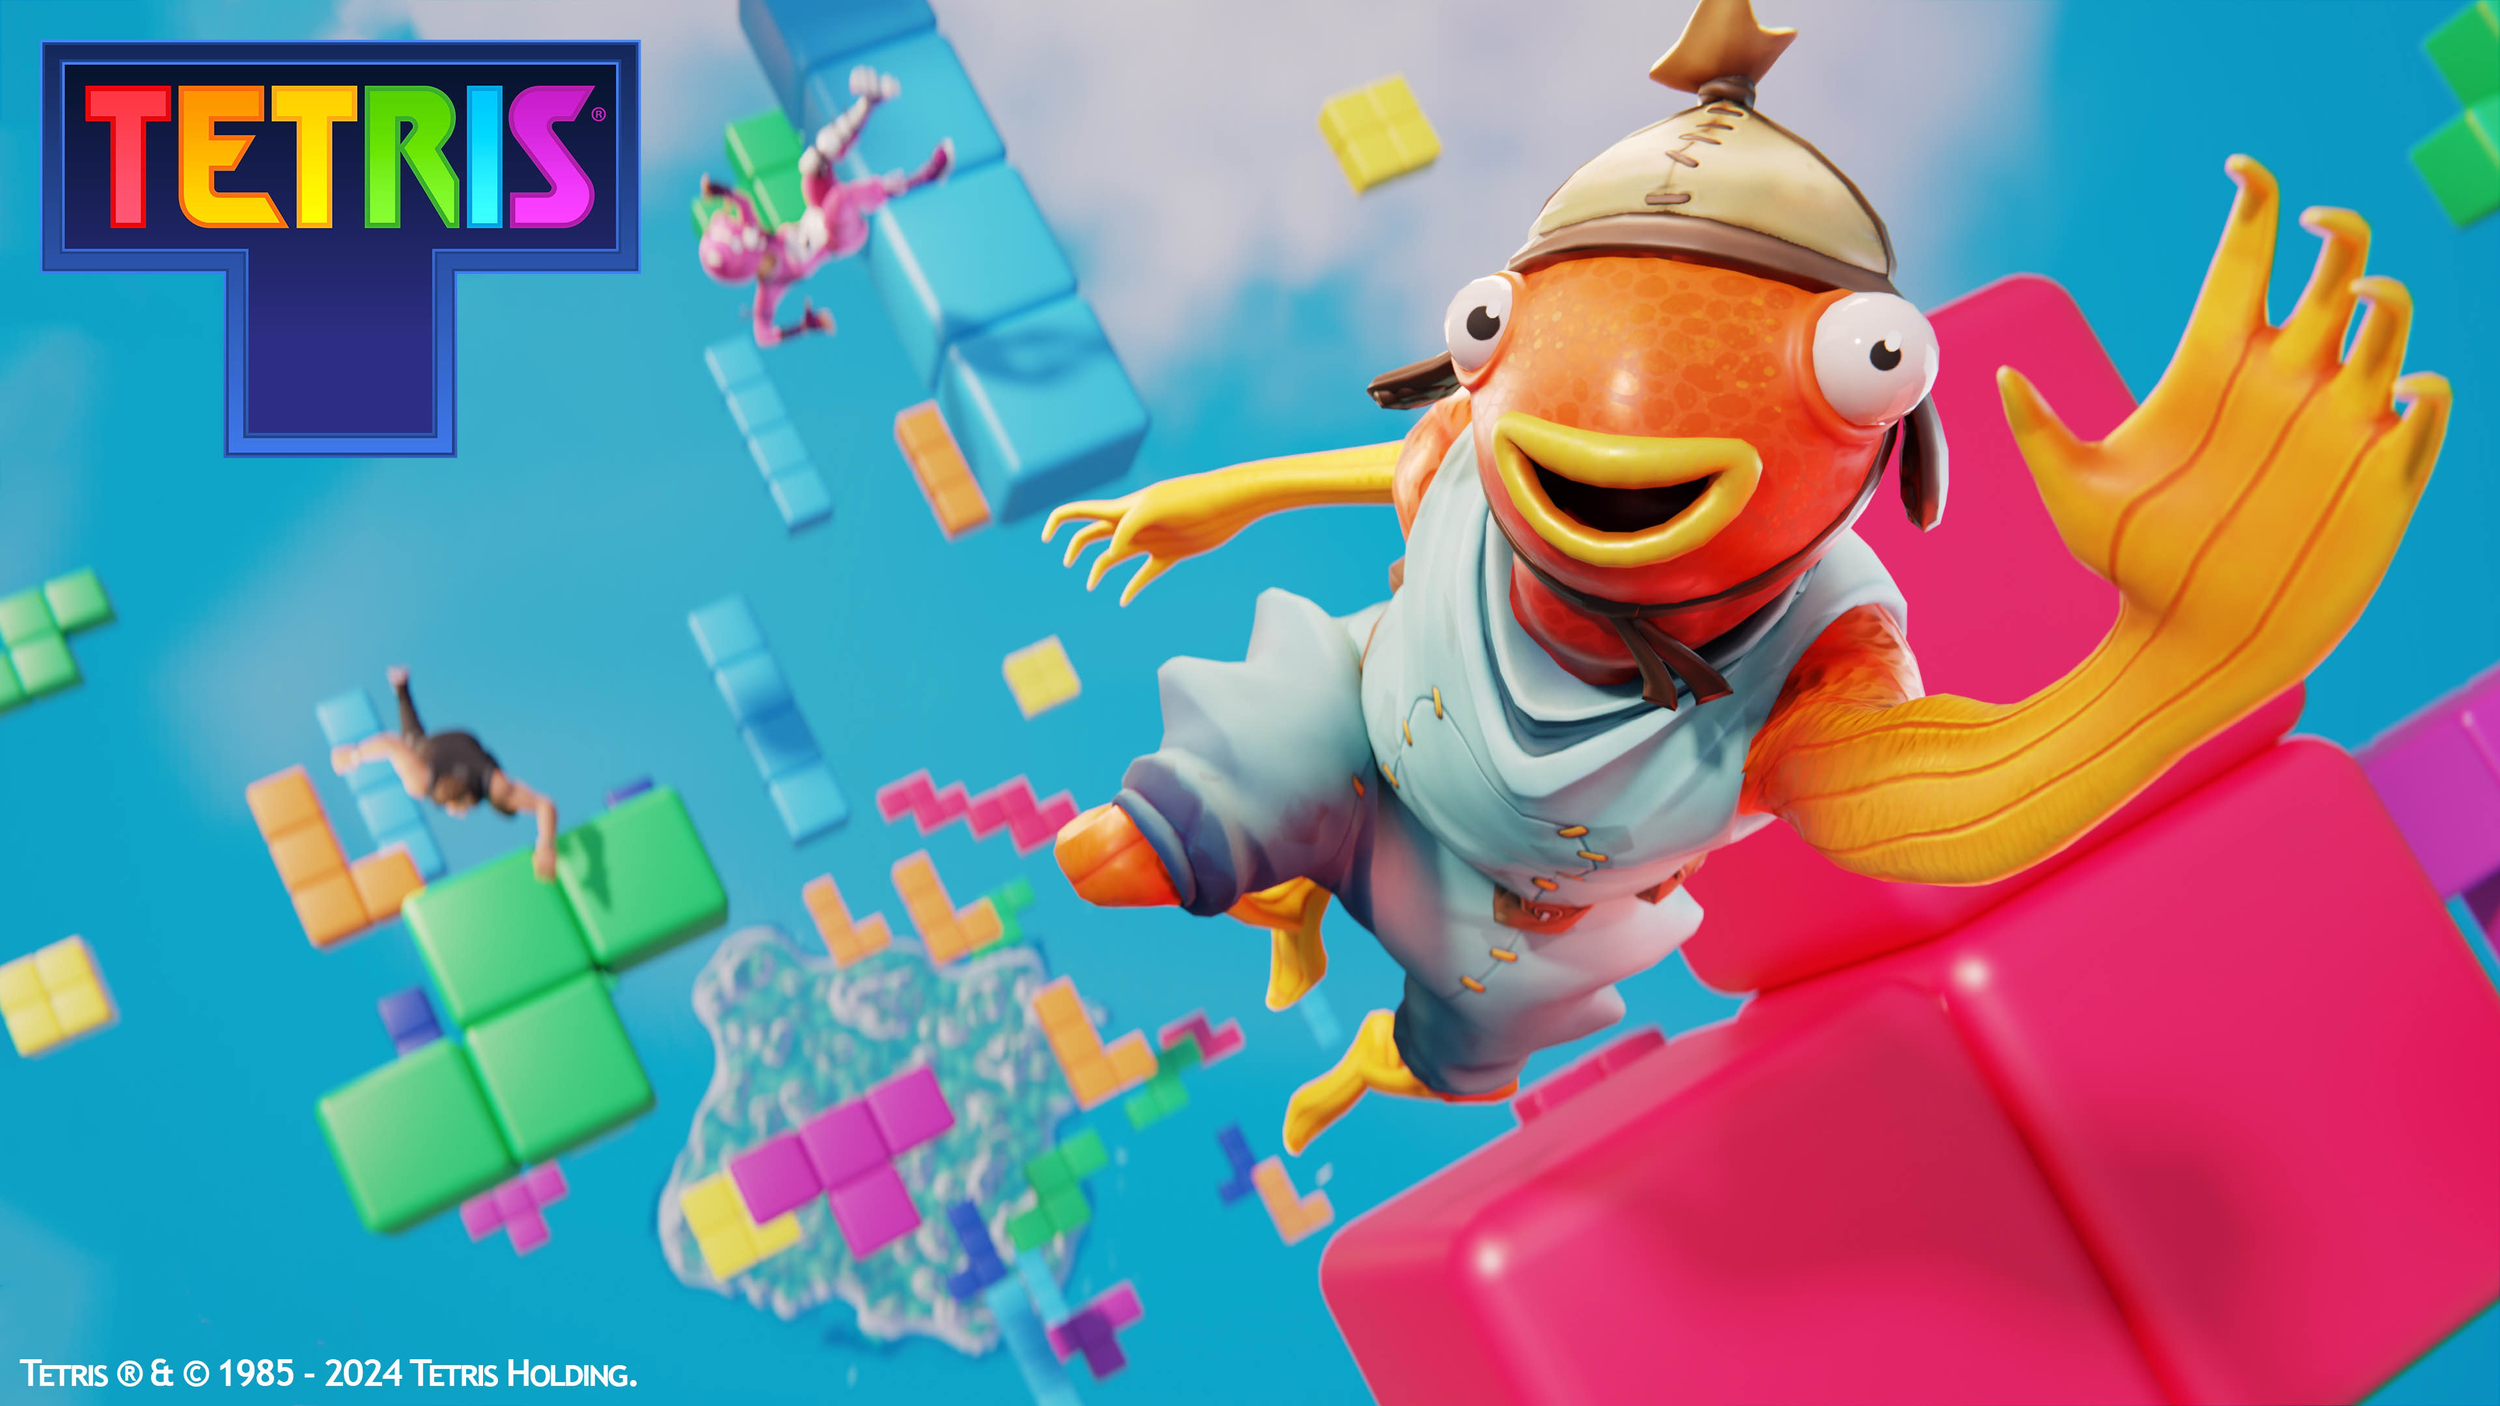
| Tetris | 24 | 391,749 | 108,221,933 |
Why Integrations Outperform
Integrations outperform because they represent distribution arbitrage.
They convert existing engagement loops into brand reach without forcing players to adopt a new destination.
Naavik states brands have increasingly abandoned standalone worlds that struggled to maintain players in favor of integrations in existing hits.
The ecosystem itself is crowded, with nearly half a million maps competing for attention, creating strong discovery friction.
Standalone islands must solve the cold-start problem of acquiring players.
Integrations avoid this problem by meeting players where they already are.
Across the campaign dataset, average impressions per player reach approximately 63 exposures.
Because exposure occurs across gameplay loops — including lobbies, spawn points, traversal routes, and repeated match rounds — brands become part of the experience rather than an interruption.
Economics of Fortnite UGC
Fortnite marketing outcomes can be understood through three currencies:
Opt-In Attention
Minutes played convert into equivalent attention exposure.
Example metrics:
Valentino Campaign
• 147,069,514 minutes played
• 588,278,056 fifteen-second equivalent exposures
Popeyes Campaign
• 39,911,376 minutes played
• 159,645,504 fifteen-second equivalent exposures
These figures illustrate the scale of opt-in engagement compared to traditional advertising formats.
Strategic Recommendations
Default to integrations for reach-led briefs
Integrations inside high-traffic UGC games deliver efficient scale and cultural embedding.
Treat standalone worlds as products
Standalone islands require sustained acquisition and retention investment to maintain player activity.
Build creator partnership layers
Creators operate experiences and amplify campaigns through streaming and social distribution.
Best practices include:
• Co-designing mechanics with host developers
• Giving creators bounded creative freedom
• Combining flat fees, performance incentives, and usage rights
• Planning amplification across livestreams, short-form video, and paid media
Measurement should track both island performance and creator performance metrics.
Future Outlook
Fortnite UGC marketing is evolving into a mature ecosystem where performance and monetization are increasingly explicit.
Epic continues to expand:
• In-island commerce
• Sponsored discovery tools
• Creator community infrastructure
Creator-made experiences now account for roughly 40% of Fortnite platform activity.
As the ecosystem matures, integrations become the most efficient format for brand activation.
For agencies and marketers, the implication is clear:
Fortnite should be treated not as a one-off innovation campaign, but as a repeatable marketing channel built on creator partnerships, integrations, and persistent player identity systems.
Sources
Epic Games Creator Economy Documentation
https://dev.epicgames.com/documentation/fortnite-creative/engagement-payout-in-fortnite-creative
Fortnite Ecosystem Report
https://www.fortnite.com/news/fortnite-ecosystem-2024-year-in-review-celebrating-creators-and-looking-ahead
Naavik Research – The State of UGC Games
https://naavik.co/deep-dives/the-state-of-ugc-games-2026
GEEIQ Research – Brand Integrations in Virtual Worlds
https://geeiq.com/4-reasons-integrations-are-now-the-default-brand-strategy-in-virtual-worlds
PocketGamer Gaming Adoption Study
https://www.pocketgamer.biz/around-70-of-uk-adults-are-gaming-with-increasing-focus-on-social-connections
Dentsu Gaming Navigator Report
https://www.dentsu.com/us/en/reports/dentsu_navigator__gaming_pdf
Overwolf Case Study – The General
https://www.overwolf.com/ads/case-studies/the-general
Nielsen Audience Benchmarks
https://www.nielsen.com/news-center/2026/super-bowl-lx-2026